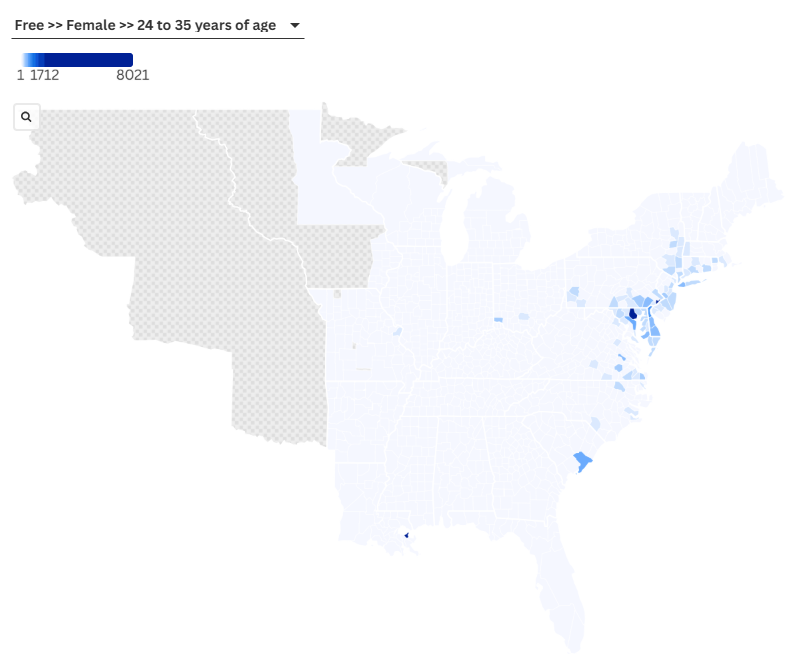
For my research question, I was interested in seeing what parts of the country had the highest populations of Free Black women in 1840. For the image I uploaded, I chose Ages 24-35.
I didn’t really run into any problems with this data visualization. However, the first data visualization I attempted did run into a bunch of problems. I have a small dataset from the Southern Claims Commission showing women’s names, ages, counties, and how much money they claimed in the SCC. I was interested in seeing the locations of the claims and seeing if they lined up with battles/skirmishes in Mississippi. However, I almost immediately ran into the main issue: I didn’t have a good census for Mississippi during this time in order to compare the population, as that was something that Flourish was asking for in order to create the visualization. Because of that, I wasn’t able to show the comparison of population density vs. claims. After that, I tried to basically put dots on the map with labels saying how much the claims were. However, this also wouldn’t work, as I realized I don’t know the exact coordinates of any of the women’s homes, or even a relative idea of WHERE in their counties exactly they live, as I hadn’t delved that deeply into the records yet.
So, in the end, I decided to use the 1840 census of Free and enslaved Black women in America. I ended up being the most interested in seeing where the largest populations of Free Black women were. I was taken aback most of all by how completely bare the South is. I had expected it to be much, much more sparse than the North, but the fact that no part of Mississippi, Alabama, Florida, etc. are shaded blue at all is surprising, as is the fact that a lot of spots up North have absolutely no blue color. Of course, the parts of the South that are darkest blue make the most sense: New Orleans, Charleston, and Baltimore, cities that I knew had larger Free Black communities than elsewhere in the South. However, I was surprised by how small these numbers still were; in Charleston, the number of Free Black women aged 24-35 was still under 500.
I would say that one way in which the readings influenced this process, particularly the article “Markup Bodies,” is that I wanted to emphasize the presence of free Black communities during this time. I feel like it’s not very common knowledge outside academia that there were, in fact, really politically and socially active free Black communities throughout the United States during the Antebellum period, even in the Southern states (and in fact especially in New Orleans and Charleston). I know of at least one case of a young enslaved woman who would often visit her free grandmother, demonstrating that even within families, freedom and enslavement coexisted quite closely. Communities of enslaved and free African Americans sometimes lived very closely together and had relationships, with free Black people sometimes helping enslaved Black people achieve freedom through the Underground Railroad or even buying loved ones out of slavery elsewhere in the Americas. Looking at this map and seeing how many free African Americans were in New Orleans, Richmond, and the Carolinas helps illustrate how that was possible. My motivation was to shed light on these pockets of free Black communities, especially throughout the South, and the articles we read helped inspire me to do so.